![HouseOf Quality.net (18)[1].png](https://static.wixstatic.com/media/72c1e3_be647acd1ed04c5db567c2601cc2723e~mv2.png/v1/fill/w_264,h_164,al_c,q_85,usm_0.66_1.00_0.01,enc_avif,quality_auto/HouseOf%20Quality_net%20(18)%5B1%5D.png)
Unveiling Data’s Hues: Unsupervised Learning’s Clues
- Ashish John Edward
- Oct 27, 2024
- 9 min read

Updated: Nov 2, 2024
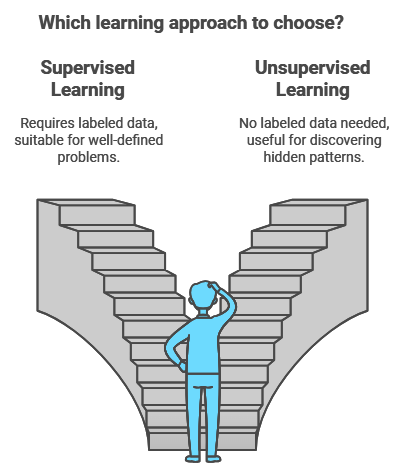
In the world of machine learning, some algorithms are like eager students, constantly looking for the right answers based on labels and guidance. These are the supervised learners. But there’s another type of algorithm—one with an explorer’s spirit, unafraid to wander into the unknown and uncover hidden patterns without any help. This is unsupervised learning, and it’s here to show us a whole new side of data.

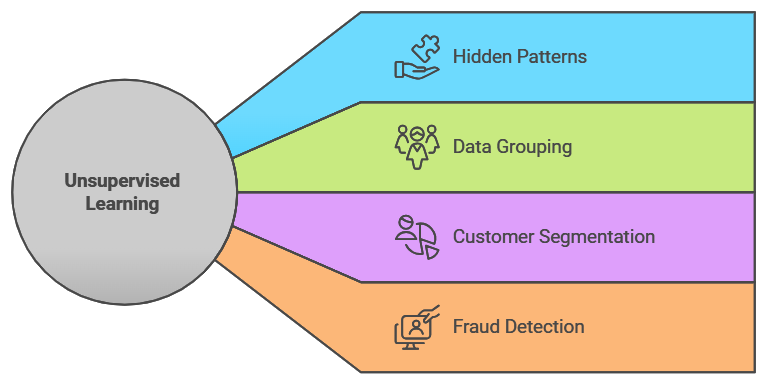
Unsupervised learning is like exploring a new city without a map. You wander through the streets, observing how certain areas have more restaurants, others have parks, and some seem residential. Gradually, you start understanding the city’s structure based on what you see, without anyone telling you what each place is. Similarly, unsupervised learning algorithms work without labeled data, grouping or organizing data based on inherent patterns and structures. This approach is particularly valuable in fields where labeled data is scarce or expensive to obtain, such as customer segmentation, fraud detection, and medical research.
So, grab your explorer’s hat as we dive into the most fascinating unsupervised learning techniques. We’ll walk through clustering, dimensionality reduction, association rules, and anomaly detection, each with its own story and practical example to help you remember these concepts long after you close this article.
Clustering: Grouping Data Like Sorting Socks
Clustering is perhaps the most intuitive concept in unsupervised learning. Imagine a massive pile of socks in various colors, patterns, and sizes. You don’t know which socks go with which, but by simply grouping them based on similar characteristics, you begin forming clusters—blue socks here, striped socks there, and so on. That’s clustering in a nutshell.
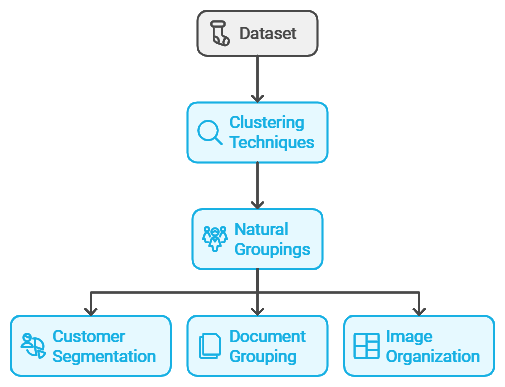
In data science, clustering is all about finding natural groupings in a dataset. This is useful for tasks like segmenting customers based on buying habits, grouping similar documents, or even organizing images by visual similarity. Let’s explore some of the most popular clustering techniques and how they work.
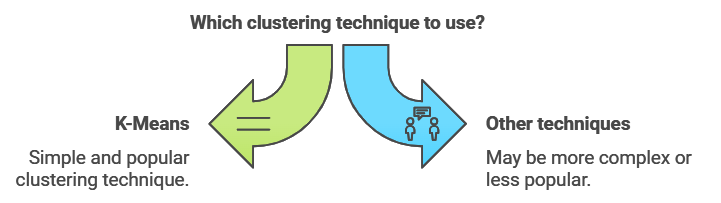
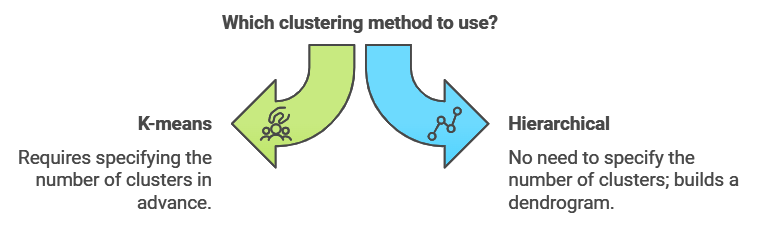
K-Means Clustering: Finding the Center of It All
K-Means is the most popular clustering technique, and it’s surprisingly simple once you get the hang of it. Imagine a group of friends standing in a field, and you want to split them into clusters based on proximity. You place a few flags on the ground—these are your initial “centroids.” Each friend walks towards the nearest flag, forming groups around it. Then, you move the flags to the center of each group and repeat the process until everyone’s grouped as closely as possible. Congratulations! You’ve just performed K-Means clustering.
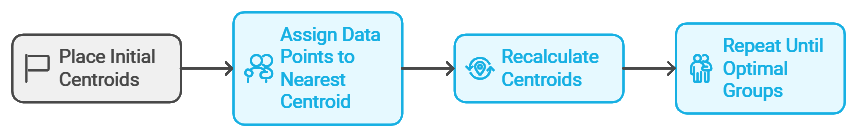
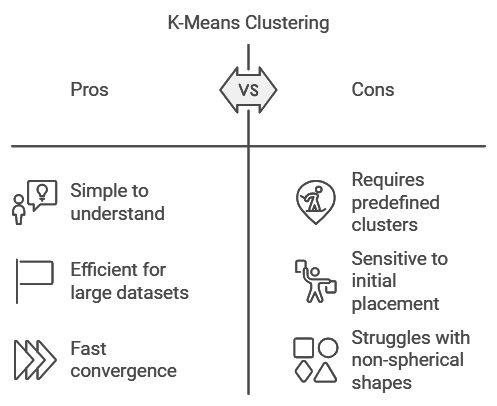
In K-Means, the “K” represents the number of clusters you want to create. The algorithm iteratively assigns data points to the nearest centroid and recalculates the centroid’s position until the groups stabilize. It’s widely used in marketing to segment customers. For example, an e-commerce company might use K-Means to identify distinct customer segments, such as “bargain hunters,” “frequent shoppers,” and “premium buyers,” each represented by its own cluster.
Example: Customer Segmentation in Retail
Imagine you run an online bookstore and want to better understand your customers. You have data on their buying frequency, average purchase size, and preferred genres, but no idea how they might naturally group. You decide to use K-Means clustering with three clusters, representing three potential customer types.
Frequent Buyers: Customers who buy often but in smaller quantities.
Occasional Spenders: Customers who buy rarely but spend more on each purchase.
Genre Aficionados: Customers who frequently buy books in a specific genre.
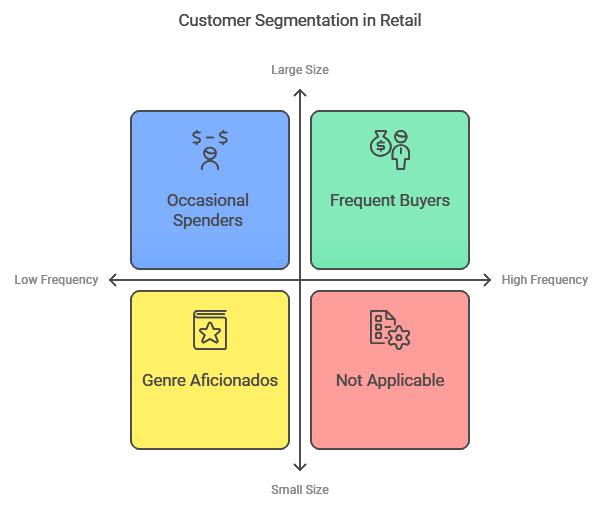
K-Means helps you identify these clusters, allowing you to personalize your marketing strategies for each type. You can target frequent buyers with loyalty programs, occasional spenders with holiday discounts, and genre aficionados with recommendations in their favorite categories.
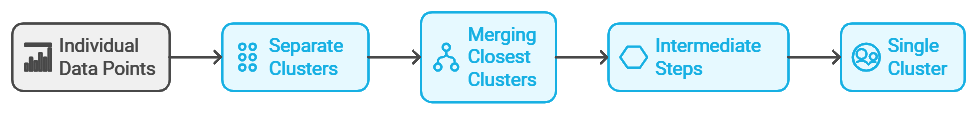
Hierarchical Clustering: Building Clusters from the Ground Up
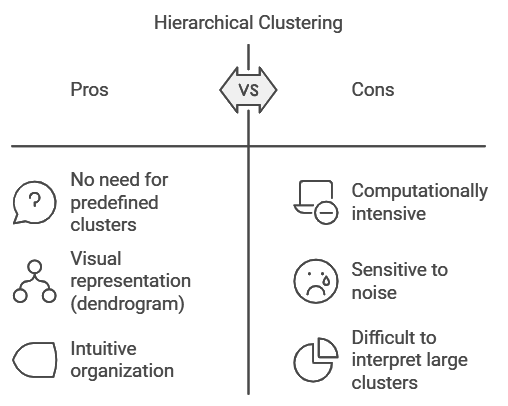
Hierarchical clustering is another popular method, particularly useful when you’re not sure how many clusters to expect. This method builds a tree-like structure called a dendrogram, where each data point starts as its own cluster. Gradually, the algorithm merges the closest clusters, working its way up until all points belong to a single cluster. This hierarchical approach is similar to how we organize animal classifications, from species up to kingdoms.
Hierarchical clustering is ideal for datasets with a natural hierarchical structure. For example, in the animal kingdom, animals can be grouped by class (e.g., mammals, birds), then by order, and so on. The algorithm creates clusters at various levels, and you can choose where to “cut” the tree based on the level of detail you need.
Example: Grouping Music Genres Based on Listening Patterns
Imagine you’re a data scientist working for a music streaming service, and your goal is to understand and group different music genres based on listeners’ habits. You have access to a wealth of data: users’ listening histories, including genres, tempo, mood, and even time of day.
Example: Grouping Music Genres Based on Listening Patterns
Using hierarchical clustering, you start by grouping songs based on shared listening patterns and features. At the broadest level, the data might naturally split into clusters like “Energetic Music” and “Relaxing Music.” Delving deeper, the “Energetic Music” cluster could separate into more refined categories like “Rock” and “EDM,” while the “Relaxing Music” group might split into “Classical” and “Jazz.” Eventually, the clusters branch into specific subgenres, such as “Classic Rock” and “Alternative Rock” within the Rock category.
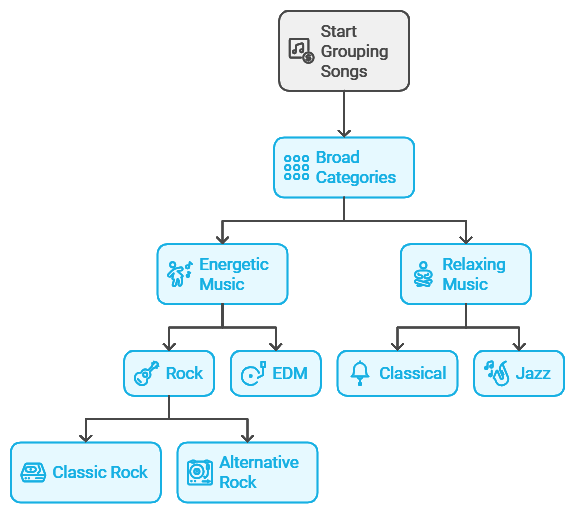
This hierarchical approach helps you organize the vast landscape of music in a way that reveals new patterns in how people listen, without needing to assign specific genre labels. These insights could guide the development of personalized playlists, helping the platform suggest songs or genres that match a user’s listening mood, all thanks to clustering without any pre-labeled data.
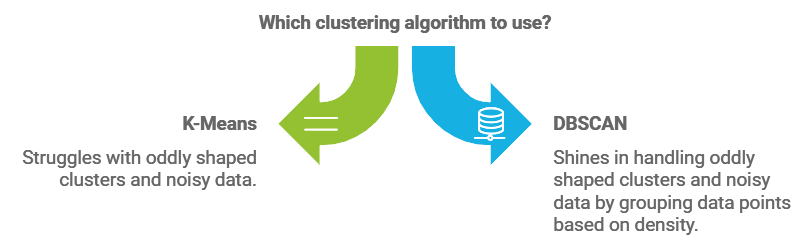
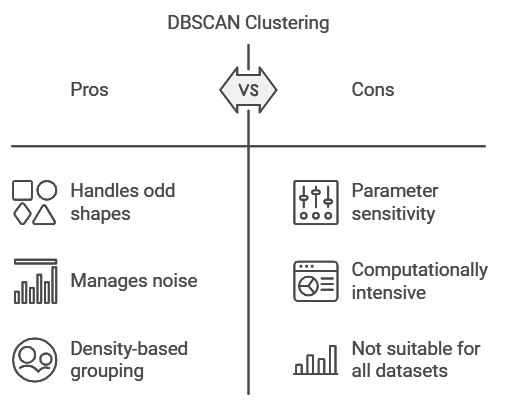
DBSCAN: Clustering with Density and Dealing with Noise
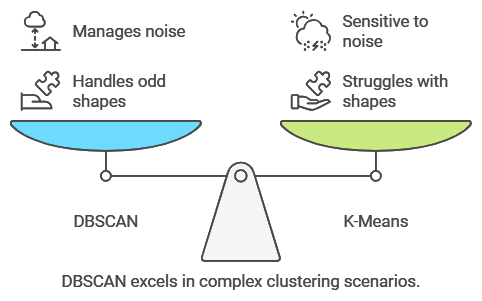
DBSCAN, or Density-Based Spatial Clustering of Applications with Noise, is a mouthful of a name but a powerful clustering technique. Unlike K-Means, which struggles with oddly shaped clusters or noisy data, DBSCAN shines in these areas by grouping data points based on density. It defines clusters as areas of high data density, separated by areas of low density, which can be treated as noise.
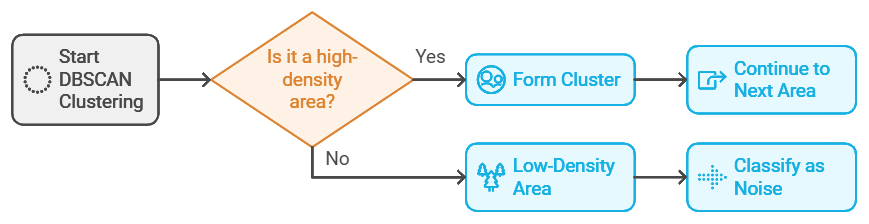
Think of DBSCAN as trying to find popular spots on a city map. If there’s a crowd in one place (high density), it forms a cluster, like a park or a busy intersection. Sparse areas are ignored as noise, just like empty streets or low-traffic zones.
Example: Mapping Popular Tourist Spots in a City
Imagine you’re analyzing GPS data to find popular tourist spots in a city. You want to identify high-density areas (popular locations) while ignoring random noise (people moving between places). DBSCAN can cluster these high-density areas, marking spots like parks, museums, and plazas as distinct clusters, while treating paths between them as noise. This insight can be valuable for tourism planning or urban development.
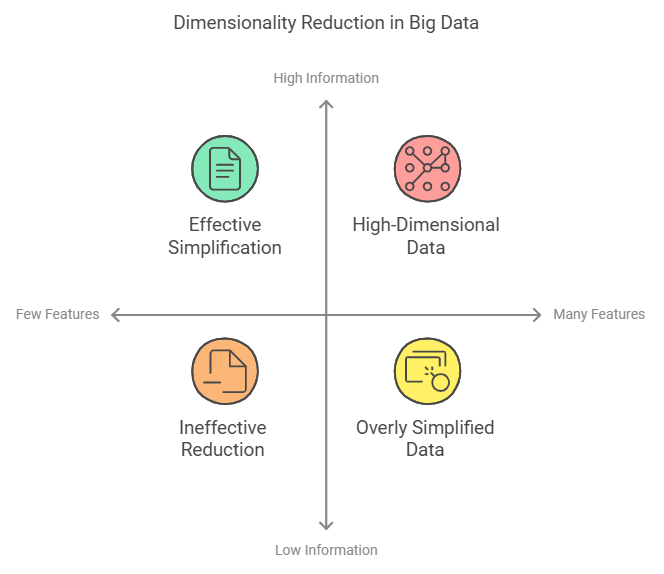
Dimensionality Reduction: Simplifying Without Losing the Big Picture
In the age of big data, datasets can contain hundreds or thousands of features. Analyzing this high-dimensional data can be overwhelming and computationally expensive. Dimensionality reduction is the art of simplifying datasets by reducing the number of features while preserving as much meaningful information as possible. Think of it as distilling a complex story down to its main points.
Dimensionality reduction techniques are especially useful in fields like genomics, where datasets have thousands of variables (e.g., genes) but only a few meaningful patterns. By reducing dimensions, these techniques allow us to focus on the key signals without getting lost in the noise.
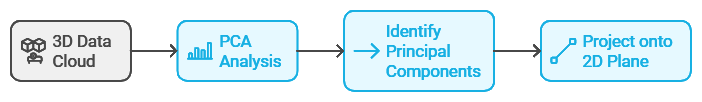
Principal Component Analysis (PCA): Finding the Essence of Data
PCA is the most widely used dimensionality reduction technique. It identifies the directions, or “principal components,” in which the data varies the most. Imagine you’re looking at a cloud of data points in 3D space, and you want to project it onto a 2D plane in a way that captures as much of the variation as possible. PCA helps you do this by finding the main axes along which the data is spread.
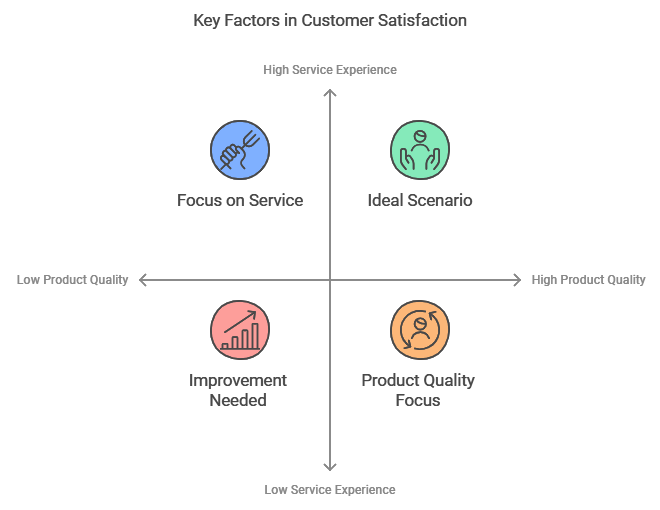
Example: Reducing Survey Data to Key Factors
Imagine you conduct a survey with 50 questions about customer satisfaction. Analyzing all 50 responses can be challenging, but PCA allows you to reduce these to a few key factors, such as “product quality,” “service experience,” and “value for money.” By projecting the data onto these principal components, you can focus on the primary drivers of customer satisfaction without being bogged down by every single response.
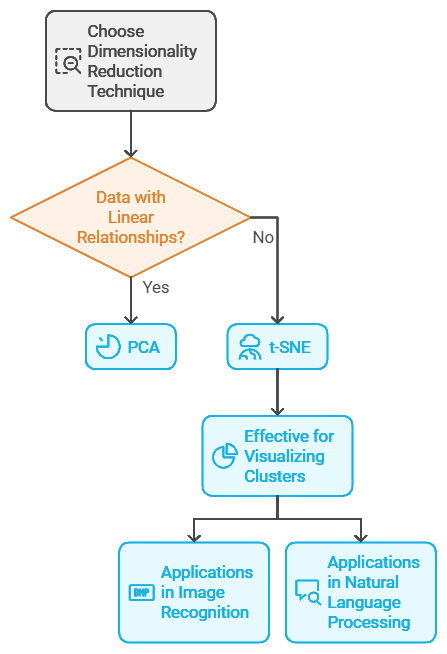
t-SNE: Visualizing High-Dimensional Data in 2D or 3D
t-SNE, or t-Distributed Stochastic Neighbor Embedding, is a technique often used for visualizing complex data in two or three dimensions. While PCA works well for linear relationships, t-SNE excels in capturing complex, non-linear structures. It’s particularly useful for visualizing clusters, making it popular in fields like image recognition and natural language processing.
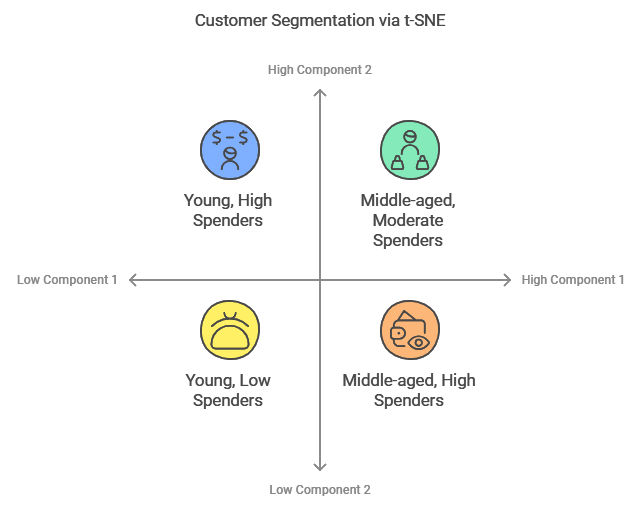
Example: Visualizing Customer Segments
Let’s say you’re analyzing customer data with hundreds of features, such as demographics, buying habits, and browsing behavior. Using t-SNE, you can project this data into 2D space, where similar customers are grouped closer together, forming clusters. This makes it easier to visualize the natural segments within your customer base, helping you design targeted marketing campaigns.
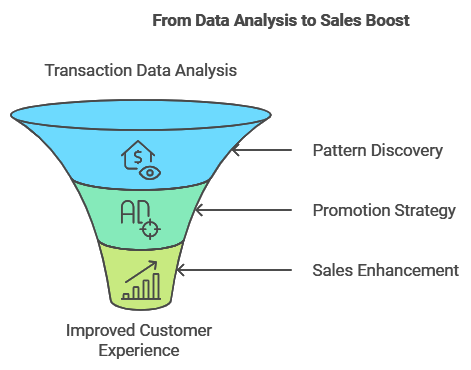
Association Rules: Discovering Hidden Relationships
Imagine you’re shopping in a grocery store, and as you’re picking up bread, you notice an entire section of complementary items—peanut butter, jelly, even honey. Association rules are like finding these product relationships automatically. In unsupervised learning, association rule algorithms look for relationships between variables in large datasets, helping to uncover patterns or co-occurrences that might not be immediately obvious.
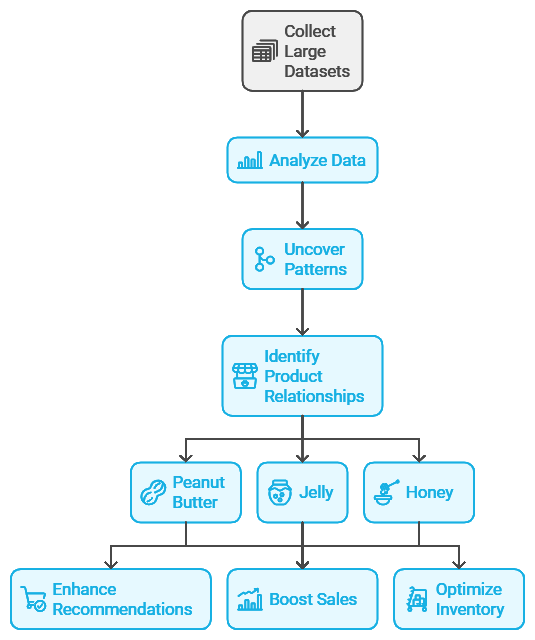
This is especially valuable in retail, where identifying product combinations can improve recommendations, increase sales, and even optimize inventory management. Let’s look at some common techniques and how they work.
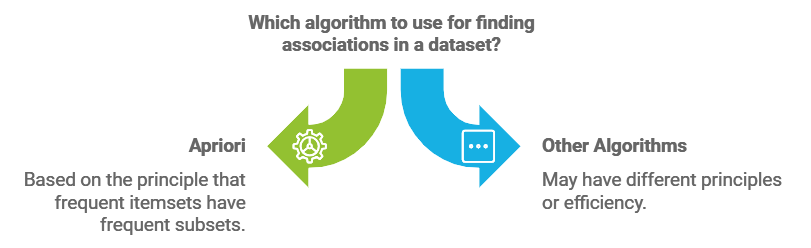
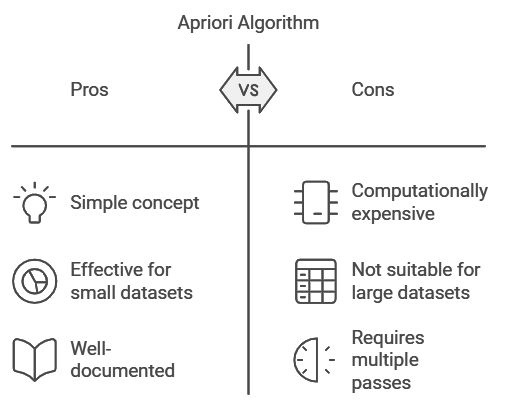
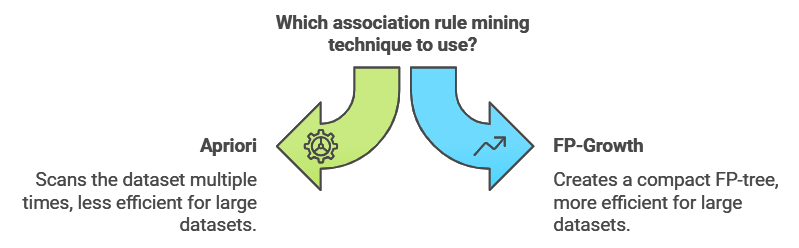
Apriori Algorithm: Building Associations One Step at a Time
The Apriori algorithm is a foundational technique for finding associations. It’s based on the idea that if a particular set of items is frequent, then all subsets of that set must also be frequent. Apriori works by iteratively expanding itemsets—starting with single items and gradually adding more until it finds the combinations that occur frequently enough to form a rule.
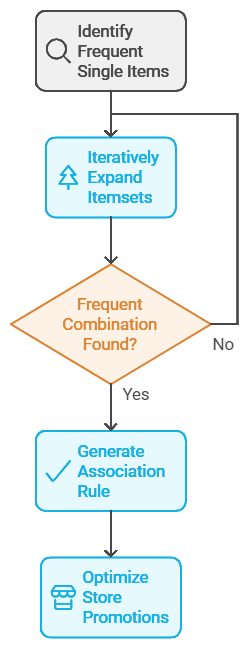
For example, in a grocery store dataset, if “bread” and “butter” frequently appear together, the algorithm might create a rule: If a customer buys bread, they’re likely to buy butter. This information is valuable for creating effective promotions, like placing bread and butter close to each other or offering bundle deals.
Example: Market Basket Analysis in Retail
Imagine you run a convenience store and use the Apriori algorithm to analyze transaction data. The algorithm uncovers an interesting pattern: customers who buy coffee are also likely to buy pastries. This insight allows you to create a “coffee and pastry” combo promotion, boosting sales and enhancing the shopping experience by making it more convenient for customers to grab their favorite breakfast items.
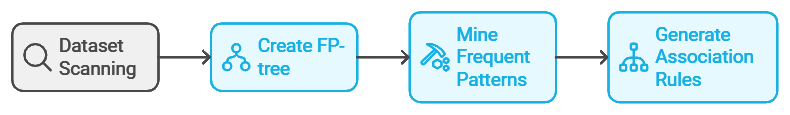
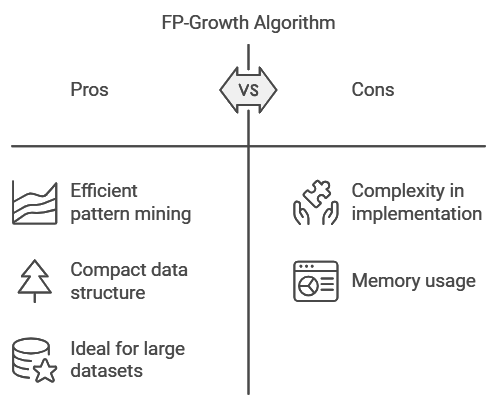
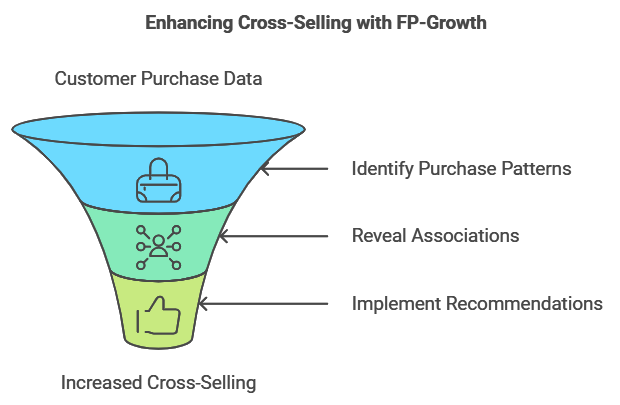
Frequent Pattern (FP)-Growth: Speeding Up Association Rules
FP-Growth is another popular association rule technique, often used as an alternative to Apriori. While Apriori builds association rules by scanning the dataset multiple times, FP-Growth creates a compact data structure called an FP-tree, which allows it to find frequent patterns in a more efficient manner. This makes FP-Growth ideal for large datasets.
Example: Cross-Selling on E-commerce Sites
E-commerce sites frequently use FP-Growth to uncover associations in browsing and purchasing patterns. For instance, the algorithm might reveal that customers who buy a digital camera often purchase memory cards as well. Using this insight, the website can recommend memory cards to camera buyers, increasing the likelihood of cross-selling and improving the user’s shopping experience.
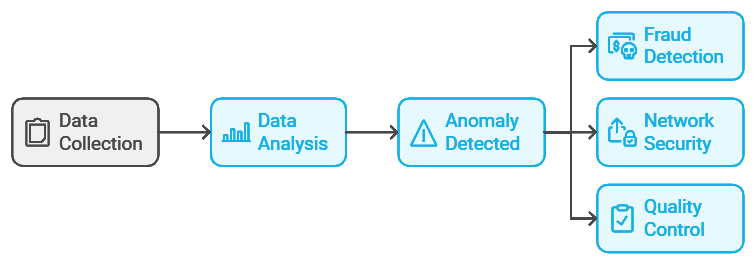
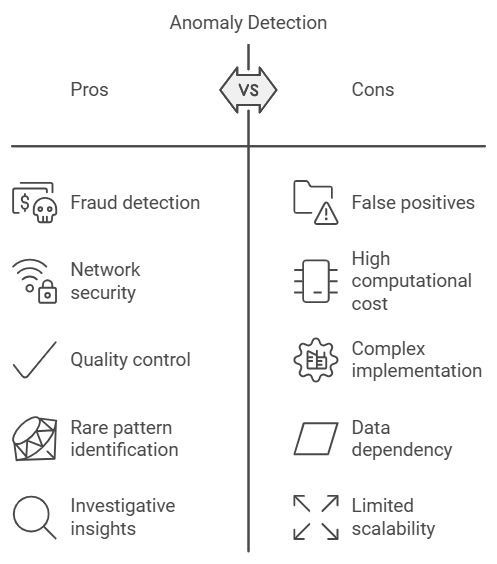
Anomaly Detection: Spotting the Outliers
Anomaly detection algorithms identify unusual or rare patterns in data, which can be incredibly useful in fields like fraud detection, network security, and quality control. Imagine running a marathon, where everyone’s pace is consistent—except for one runner who’s sprinting at double the average speed. That runner is an “anomaly.” In machine learning, anomalies represent data points that deviate from the norm, often signaling something worth investigating.
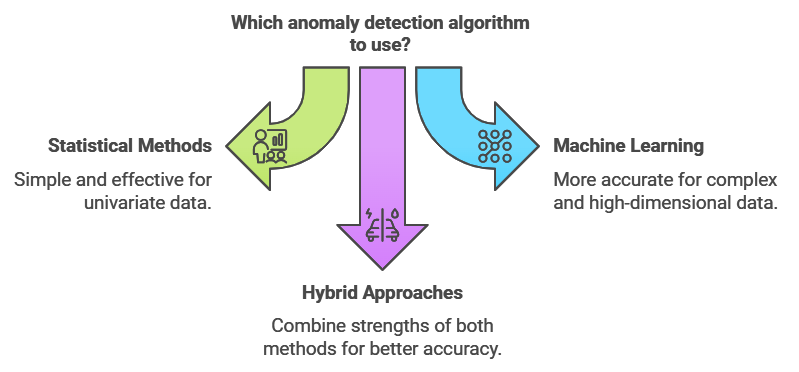
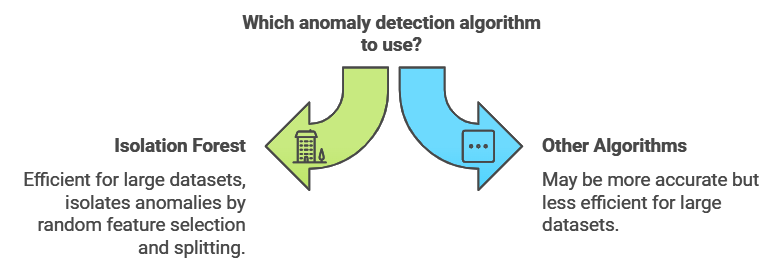
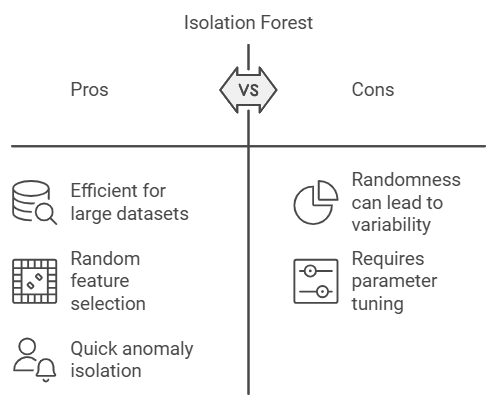
Isolation Forest: Detecting Anomalies by Isolation
The Isolation Forest algorithm is like a detective who investigates outliers by splitting data into smaller and smaller subsets. The idea is simple: anomalies are easier to “isolate” because they’re different from the rest of the data. Isolation Forest randomly selects features and splits values to isolate anomalies quickly, making it efficient for large datasets.
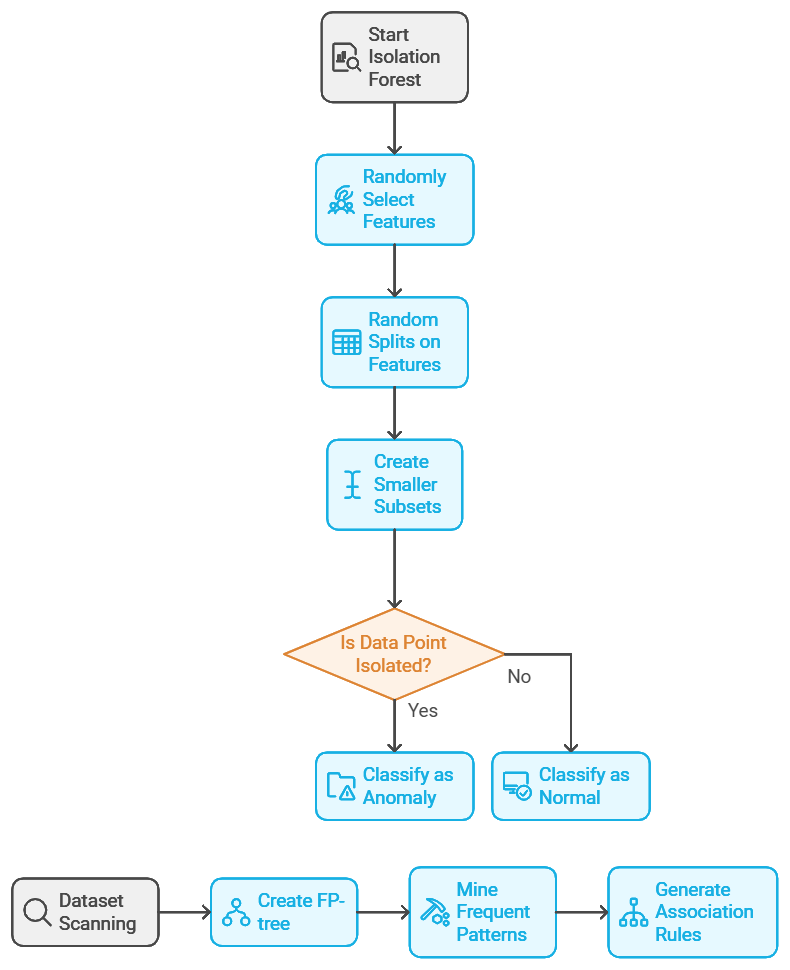
Example: Fraud Detection in Banking
Imagine a bank using Isolation Forest to detect credit card fraud. Most transactions follow a regular pattern, but occasionally, an anomaly appears—say, a transaction far from the customer’s usual location or a sudden, large withdrawal. Isolation Forest can flag these unusual transactions, allowing the bank to investigate potential fraud in real time.
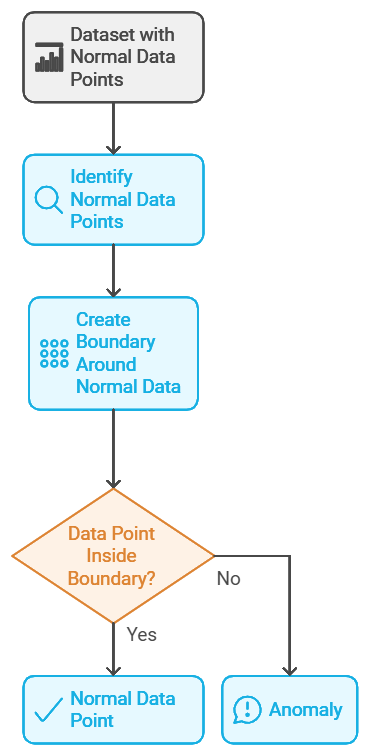
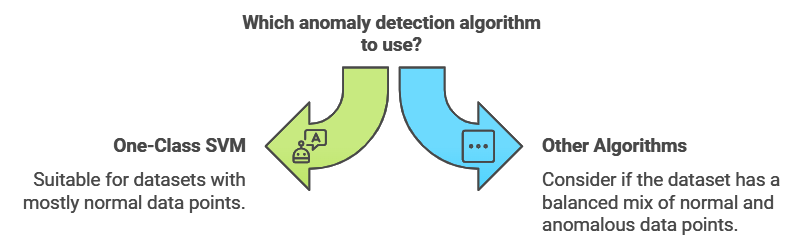
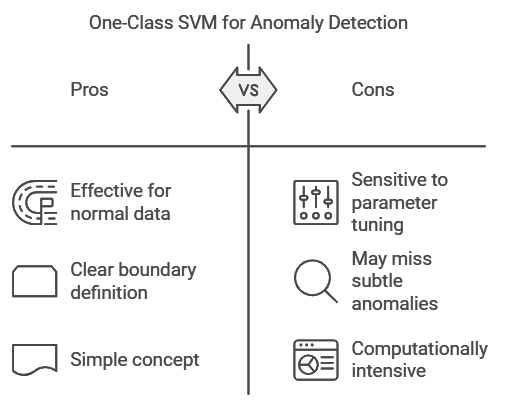
One-Class SVM: A Boundary Around the Norm
One-Class SVM (Support Vector Machine) is another algorithm used for anomaly detection, especially when the dataset primarily contains “normal” data points. It works by creating a boundary around the norm, and any data point falling outside this boundary is considered an anomaly. Think of it as drawing a circle around all the normal runners in the marathon example, where anyone outside the circle is an outlier.
Challenges in Unsupervised Learning
Unsupervised learning opens doors to insightful patterns, but it comes with its own set of challenges:
Interpretability: Unlike supervised learning, where labels help interpret results, unsupervised learning requires analysts to infer the meaning of clusters or patterns. For example, discovering customer segments doesn’t automatically explain what each group represents; human insight is often necessary.
Choosing the Number of Clusters: In clustering, determining the right number of clusters can be tricky and subjective. Methods like the “elbow method” help, but the choice often depends on the data and the problem context.
High Computational Complexity: Some algorithms, like hierarchical clustering, can be computationally intensive, especially for large datasets. Optimizing computational efficiency is crucial in real-world applications.
Handling High-Dimensional Data: In dimensionality reduction, simplifying data without losing essential information is challenging. Techniques like PCA reduce complexity but may lose interpretability, especially when projecting high-dimensional data into just two or three dimensions.
Yet, the story doesn’t end here. This article has provided an introduction, but each algorithm and technique will have a dedicated article to dive deeper into how it works, its specific applications, and the unique challenges it tackles. And as machine learning continues to evolve, new unsupervised learning techniques will further reveal the rich, unexplored depths of data.
In the upcoming articles, we’ll continue exploring the world of machine learning by diving into reinforcement learning—a fascinating approach where algorithms learn through rewards and feedback. So, stay curious and ready to explore; the journey through the world of machine learning is just beginning.


Comments